PCPS Succession Institute 2016 Succession Survey Results for Multi-Owner Firms Part 6
This article summarizes selected results of the Private Companies Practice Session (PCPS) and Succession Institute (SI) 2016 Succession Planning Survey (the full survey results available through the PCPS Resource Center). This is the fourth such survey conducted since 2004. Part 1 of this column series covered the results for Solo Practitioners and Sole Proprietors. Part 2 covered Demographics, Succession Plan Status, Ownership Retirement projections, and Firm Infrastructure. Part 3 started with Mandatory Retirement and concluded with the calculation of the original valuation of the retirement benefit. Part 4 reviewed how firms might adjust the original valuation benefit based on actions or inactions of the retiring partner. Part 5 discussed policies for transitioning client relationships and continued through the challenges firms are trying to address that represent barriers to your firm's effective succession management. Now we pick up with the final section of the survey results, Part 6, which starts by addressing the People Side of Succession, Compensation and Other Entities CPAs commonly utilize.
Dealing with the People Side of Succession Planning
Over the years, these succession surveys have seen a consistent percentage of responses showing that many firms do not have formal written requirements for admission to partnership. This year’s survey features some revised, and some additional, response options that take into account the more predominant “other” responses from past surveys.
What are your firm's identified and formalized requirements for new owners?
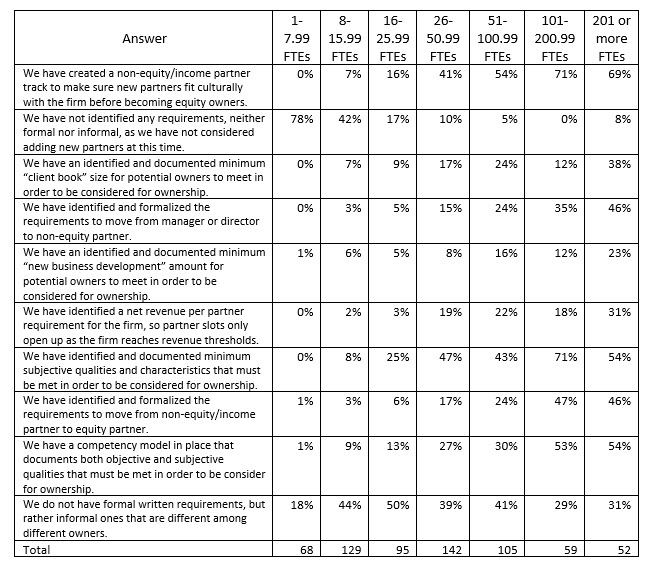
 This year, in the 387 responses to our question about formalized requirements for new owners, we see that still about 70% (32% + 37%) of all firms do not have either formal or informal requirements for admission to partnership, partly (32%) because they are not currently considering adding any new partners at this time, and partly just because they use informal guidelines that vary among partners (37%). About one-fourth of the firms (24% in this survey; 24% to 29% in past surveys) indicate that they’ve documented some minimum subjective requirements for admission to partnership.
Generally speaking, few firms (17%) are using formalized, objective competency frameworks to set out expectations for admission as partners. In our view, even if a firm does not have current candidates for admission as a partner, the partners should define what it takes to become a partner now so their current professional staff will know what they need to do in order to become a partner in the future. Creating a clear path to partnership helps identify competency gaps that need to be closed and allows those gaps to be closed through coaching and development opportunities.
As the following table illustrates, the larger the firm, the more likely a positive response to the statement “we have created a non-equity/income partner track to make sure new partners fit culturally with the firm before becoming equity owners.” This is wise inasmuch as it helps avoid time-consuming, costly efforts that are often required when the decision to become an equity partner is made without the benefit of the additional time working together in a partner-level position having partner-level discussions.
The smaller the firm, the more likely that it does not have formal written requirements for new owners, including clearly defined expectations for revenue per partner, new business developed, or competencies at the partner level. However, across all firm sizes, and higher than expected response rates at larger firms, many simply are using informal requirements that are different among different owners. It seems that succession management could be facilitated far more easily if more firms used a clearly defined competency framework as a career path to partnership. People at all levels would know what is expected of them to advance, training and coaching could be more focused, and effectiveness of developmental efforts would be improved dramatically with higher ROIs on such efforts.
Infrastructure Put in Place to Facilitate Leadership Transition
What initiatives/processes are you implementing or have implemented to create an operating environment that will facilitate the seamless transition in governance with minimal disruption of profitability, culture, services, etc. between the retiring owners and the remaining owners?
In this “select all that apply” question, we featured some additional and revised response options derived from the more predominant “other” responses from past surveys and current best practices in the profession regarding seamless transitions and maintenance of effective and efficient operations.
The data is fairly consistent among this and the previous two surveys for the choices “Holding partners accountable to operating policies and procedures and individual goals using compensation as a stick to reward or punish compliance” and “Updating your partner compensation system so that the managing partner can hold partners accountable to achieving annual specific goals.”
The 378 responses to this question show that there has been an uptick in the number of firms moving from a Silo or “Eat What You Kill” business model to a one-firm business model, with a total of 44% indicating this is the case, compared to about 37% in past years.
On the other hand, the percentage of firms indicating that they are changing expectations to avoid working excessively long hours worked has consistently decreased from 43% in 2008 to 38% in 2012, down to 32% this year. In our experience, we find a variety of firm practices regarding the number of hours’ people are expected to work. For example, some firms continue to acquire more work than can be comfortably done with existing staff capacity, albeit with the intention of adding more people that never seem to get hired. We also see some firms that actively discourage partners, directors and managers from working excessively long hours because of the implicit negative message (“you too can look forward to working these long-hours soon”) it sends to up-and-coming staff that might be candidates for leadership in the future.
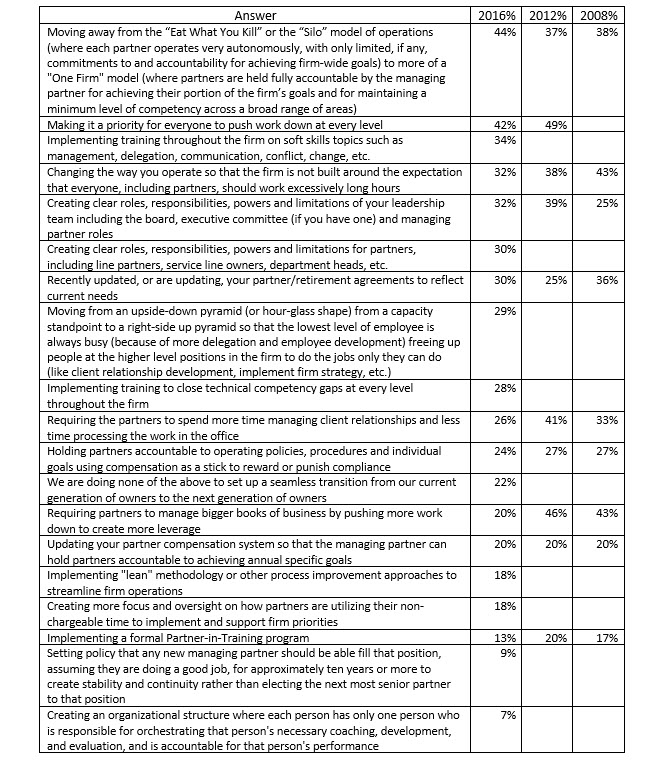
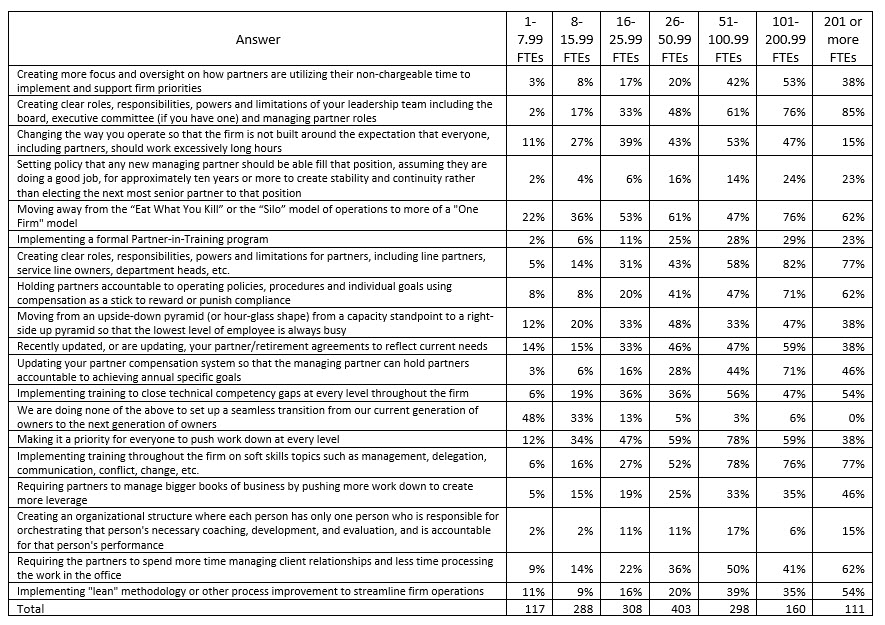 It is natural for small firms to start off using the Silo or “Eat What You Kill” (EWYK) business model. But as the firm grows and become more successful, the benefits that the EWYK model provided quickly become overshadowed by the problems that the model creates. Therefore, growth necessitates moving from a business model that was foundational to a firm’s success to one that is unknown and foreign to them (what is commonly called the one-firm concept or what we call “Building a Village”). As you can see, this trend is borne out by these survey results when you look at firm size. In addition to this, many larger firms retain some elements of the Silo/EWYK model, so we see them moving toward a more complete one-firm business model. This is evidenced by the results of the other issues listed in this question (these other questions outside of the business model are predominantly a list of tactics firm implement as they move from a Silo/EWYK model of operations to the one-firm business model). Generally, the smaller the firm, the less likely it would be embracing the tactics to move away from a Silo/EWYK business model which still might be working for them.
Which of the following are you doing right now to develop the future leaders of your firm?
We received 382 responses to this “select all that apply” question, which has, as many questions have throughout this survey, an expanded and revised list of options from which respondents could choose. The percentage of responses indicating identification of, and training for, specific competencies continued to decrease from a high rate in 2008 of 75% to 53% this year. We believe that this is probably attributable to the fact that more and more firms have become more familiar with the concept of competencies and competency frameworks, rather than an actual decrease in usage thereof. As in the past, fewer firms claim they are using competency frameworks to identify requirements for admission to partnership (17% this year) than claim to be using competency-based training to develop leaders.
Response rates addressing formal education in soft, or interpersonal, skills and in management and delegation are fairly consistent with past survey response rates, as are responses regarding the use of formal in-firm mentoring programs and partner or manager development programs.
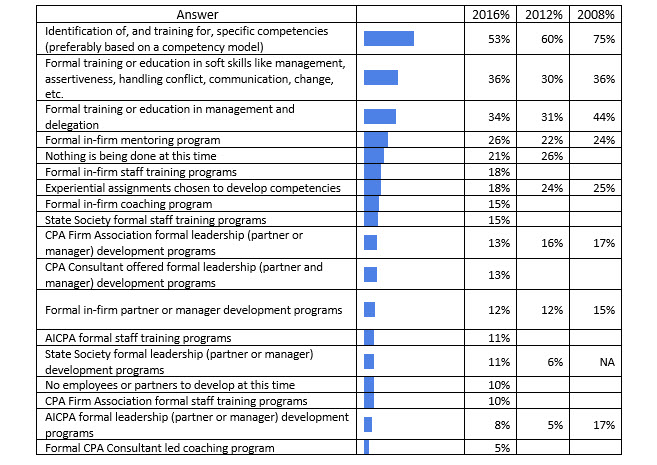
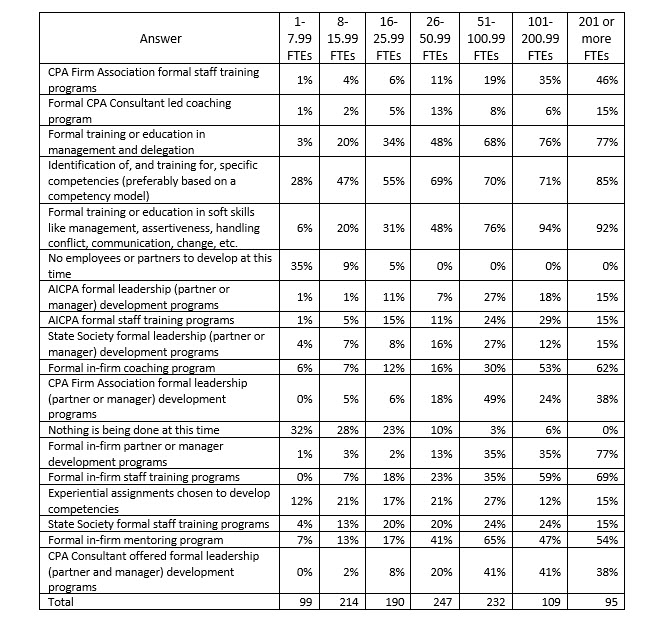
Generally, the larger the firm, the more likely it is employing some to many of the techniques listed above. Even with that general distribution of responses, it is alarming to note is that there are any of the larger firms “doing nothing to develop leaders at this time,” but are you can see, 3% and 6% respectively of the firms in the 51 to 100 FTE and 101 to 200 FTE categories gave this response. Of course, the smaller the firm, the more likely it is not doing anything at this time to develop future leaders, which, in some cases is due to the fact that in the smallest firms there are no employees at that level to develop.
Which are you doing to make your firm more profitable, increase its value, or make it more attractive to either an internal or external buyer?
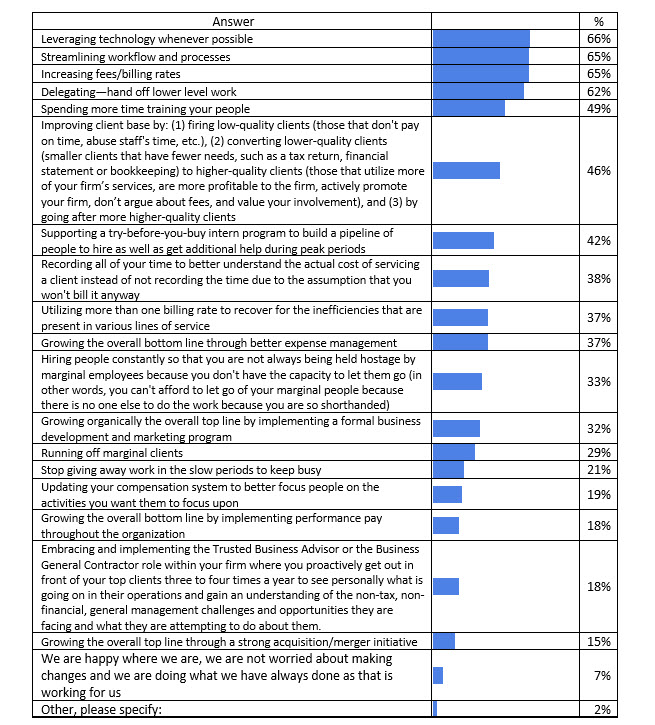 There were 385 responses to this question, which showed that over 60% of firms are addressing technology, work flow, delegation and increased billing rates. Nearly half are spending more time training staff and trying to improve their client base.

Many or most of the profitability improvement tactics listed in this question are being utilized more by the larger firms than the smaller firms. For example, firms in the largest size category are almost twice as likely to be leveraging technology than those in the smallest category. Technology can be an even more powerful lever for the smaller firms who have limited personnel resources, so it is interesting to see the lower rates of response on this.
The very largest firms cited the use of delegation with the least frequency. This is probably because they have been delegating fairly broadly for some time and continue to do so. For the firms in the other size categories, however, the response rates probably reflect an interest in doing more delegation, in an effort to move owners into more partner-level functions and tasks. This squares with our experience, where we find that much work remains to be done in delegation among many of the smaller to medium-sized firms.
Smaller firms, particularly those in the less than 16 FTEs size categories, seem to be spending less time training their people, are using interns less, and not hiring as constantly as other sizes of firms. This may be due in part to the fact that they have fewer people and less leverage to begin with, which makes it seem to be more difficult to take advantage of these tactics. However, unless they can find a way to begin doing more of these things, they may always be short of the capacity to grow to the next level.
Similarly, the smaller sized firms seem to be missing out on leveraging their role as Most Trusted Business Advisors™ compared to the larger firms. This can make their clients easy targets for competitors. We believe that part of the reason for the lower response rates among the smaller firms is that the owners and managers are not leveraged properly and therefore either do not have, or do not take, the time to function in a business advisory capacity. This lack of leveraging, related to lack of appropriate delegation, can also lead to the lower utilization of formal business development plans seen in the above table.
The largest firms are nearly twice as likely to be improving their client base as the firms in the two smallest client categories. Smaller firms need to embrace this approach as well. Moving “upstream” to better clients will not only improve profitability but also add more opportunities to function as a Most Trusted Business Advisor™.
As might be expected, the larger the firms, the more likely they may be using mergers and acquisitions to grow their business.
Compensation Process and Accountability
Does your firm use an open (every owner knows what the other owners are paid) or closed (only a select few like the managing partner or compensation committee know what all the owners are paid) compensation system?

In this survey, there was a somewhat higher percentage of firms using a closed compensations system, 24%, compared to the previous survey, 16%.
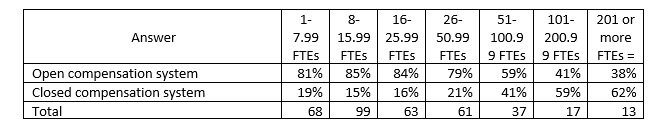
Although the firms in the two largest size categories favor closed compensation systems, a rather high proportion of the rest of the firms maintain “open” compensation systems where every owner knows what every other owner makes. This makes sense because as firms grow larger, especially when they get to around 20 partners in size, most partners don’t even know what most of the other partners do, or how well they are doing it. But when firms are smaller, everyone works more closely together and at least has a feel for the value that a partner brings to the firm.
In the end, the value of a closed compensation system is the fact that no one knows what anyone else makes so there is less squabbling about relative pay levels. The value an open compensation system brings is the transparency that can lead to greater trust. Both types of compensation systems have their place, but each has both positive and negative consequences. Therefore, it is important for each firm to weigh the pros and cons against and determine what is best for it.
Which of the following best describes your compensation system? Our owners get paid:
The breakdown by type of compensation system this year is very similar to what it was in the previous survey:

Smaller firms generally tend to favor primarily objective metrics for pay, while larger firms have more of a tendency to look at both objective and subjective measures, most likely because they have found that it provides the firm with better results overall and can’t be gamed as easily. Doing some math outside the tables shows that objective-only incentives had the highest response of 62% (30% + 32%) from firms with less than 8 FTEs. The lowest response rate for objective-only incentives, at 6% (6% + 0%), came from firms with 101 to less than 201 FTEs. On the other hand, the larger firms make a much greater use of some combination of subjective (qualitative) and objective incentives than the smaller firms do (94% compared to 38%). Firms with 26 FTEs and larger averaged a 78% response rate for utilizing both incentives in their compensation system.
But we wanted to break this down even further. When you look at the size of firms that pay a base salary plus incentive, whether the incentives are objective or subjective, more firms are opting towards this approach. In calculating an average of the percentages from the columns by size of firm, we find that roughly 60% pay a base salary plus incentive, compared to about 40% paying no guaranteed salary with all pay during the year being simply a draw against final incentive performance. There was no clear pattern looking at guaranteed salary versus draw when it came to firm size, as firms with less than 8 FTEs were at 62% (30% + 32%) versus 26 to less than 51 FTEs being at 48% (17% + 31%) versus firms with 101 to less than 201 FTEs totaling 71% (6% + 65%) used guaranteed salary. Nor was there a pattern regarding firm size regarding those who opted to use the draw against incentives method.
Which factors impact the distribution of earnings in your compensation system?
In this “select all that apply” question, with 381 responses, we added some new options based on concentrations of answers last year in the “other” category. Profitability, a new option for this year, garnered a 59% response – the highest of all of the earnings factors. We expected some of the new factors to score much higher than they did:
- “performance of individual goals trickled down from the strategic plan” ended up with only 13%, and
- “business transferred to other partners/managers” came in at only 11%.
These are two factors we almost always discuss as potential options for consideration. Generally, we find all of these factors being used over the course of working with multiple firms of various sizes, with some of them more commonly found in the Silo/EWYK model and others mostly seen in the one-firm model of operations.
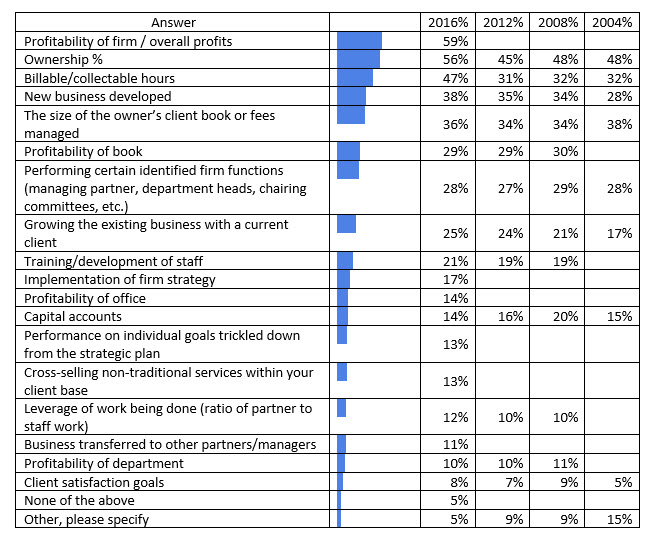

The factors highlighted in gray above represent common factors that are important to implementing and sustaining a one-firm model of operations because they are about partners doing something separate and apart from owning a specific equity interest, doing the work, managing the clients, etc. They focus on how one approaches doing those things, such as using leverage, or being asked to make an impact on a strategic planning initiative, or improving competencies and capacity through training. These types of factors typically require an incentive pay system if you want to make headway in accomplishing them. All of these, generally, trend upward with firm size.
This table has a number of surprises in it. For example, ownership and capital as a factor doesn’t really have a pattern or change much based on firm size. New business developed, and billable/collectable hours, which in the Silo/EWYK model is very common, came in far lower for smaller firms than we expected, and far higher than we expected in larger firms.
As we expected, use of profitability of a book, of a department, of an office, and of the firm as pay factors tend to increase with firm size. And we definitely expected to find more importance attached to the management roles and responsibilities that a person fills in larger firms. Based on these survey results there is a dramatic difference based firm size. In many smaller firms, especially under the Silo/EWYK model, management isn’t considered to be really important, but rather, a nuisance factor that people have to do once they finish their “real” job of doing billable work.
Which best describes the role of the managing partner in the partner compensation process?
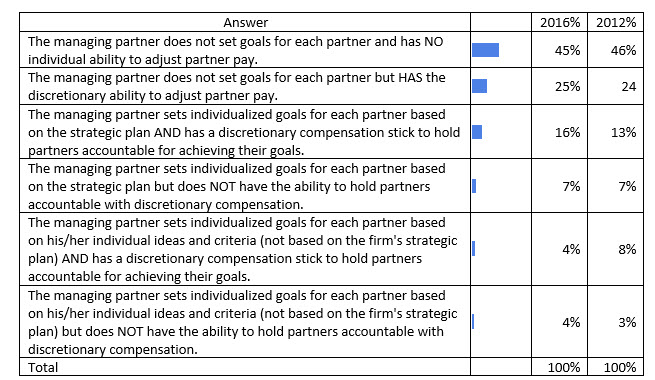
Of the 363 responses to this question, highest rate of response (at 45% of firms) for the role of the managing partner in the compensation process shows that he/she doesn’t really have a role in the compensation process. Unfortunately, this is the worst possible answer if a firm wants to hold any of its partners accountable for anything. Coming in with a 16% response is the answer that is the most effective way to successfully implement firm strategy and hold partners accountable, which is for the managing partner to set goals based on the firm strategy and have a compensation stick to hold partners accountable to achieving them. As you can see, there hasn’t been much change in these responses between this survey and the last one.
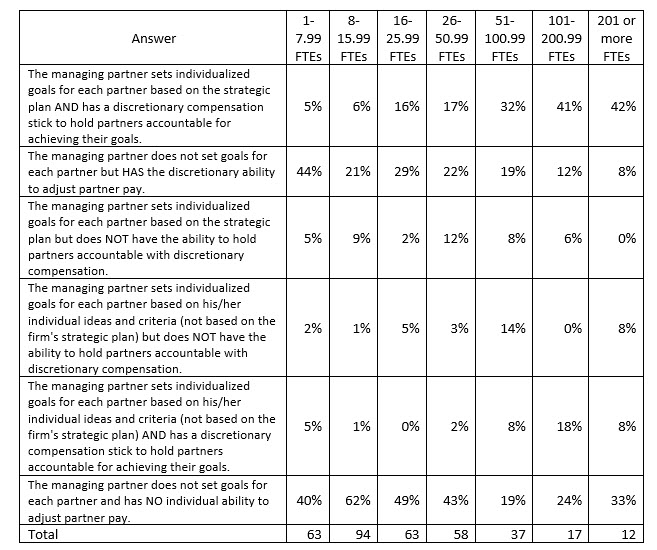
There are several points to note when looking at the data based on firm size. First, the larger the firm, the more the managing partner is expected to set goals based on the strategic plan and to have a compensation stick to hold partners accountable. The smaller the firm, the more likely the managing partner doesn’t bother to set goals, but has a compensation stick to hold partners accountable (this is almost assuredly because the managing partner is also the single biggest shareholder and has that power by vote).
Then, as a firm grows, as you can see somewhat supported by the table data, the managing partner loses voting control, and as a result, the managing partner doesn’t set goals, but the rest of the partners strip away the power to impact compensation. Having the managing partner set goals without a compensation stick is, in our experience, a waste of a very scarce resource. Nothing significant or dependable will come out of that effort.
Letting the managing partner set goals based on his or her individual opinion rather than the strategic plan, with or without a compensation stick, is a severe violation of good governance. The few larger firms who have managing partners who set goals based on their individual opinions, with a compensation stick, probably do so because the managing partner is a founding owner or an owner who still has voting control. A managing partner who has power to ignore firm strategy and hold partners accountable to his or her own agenda is a managing partner with too much authority. This violation of good governance is almost guaranteed to stop once that owner retires inasmuch as the remaining partners will not allow anyone to have that potentially abusive level of authority going forward.
If the managing partner does not set individualized partner goals, who does, if anyone?
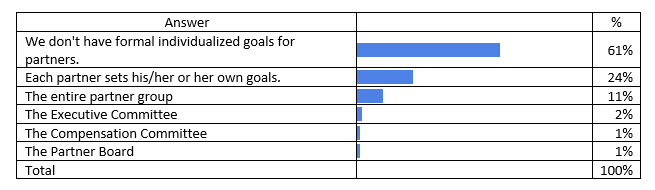
Firms responding that their managing partner does not set individualized goals were asked the question above. 92 respondents were provided this question and 61% of that group stated that partners do not have formal individualized goals set for them. Of those who did have formal goals set for partners, 24% said that each partner set his/her own goals, 11% said the partner group as a whole set goals for the partners, with the remaining 4% leaving that function to a smaller group of partners (Executive or Compensation Committee or Partner Board).
While you might guess that those answering set goals (versus the ones that said they do not set any goals) are much better off, generally speaking, we don’t see that. When individuals set goals for themselves, even if they achieve them, because no one person is making sure those goals align with the other partners and with strategy, the goal system is marginally effective at best. This is because of the lack of alignment and due to the lack of accountability to achieve those goals. On the other extreme, when goals are set by a group of people, and therefore individual partners are held accountable by a group of people, that usually means that no one will be held accountable. The exception to this is when a group sets objective firm metrics for all partners to achieve. The objective metrics approach create accountability since the resulting compensation is simply a formula-based answer. But in our experience, these systems only work well under the Eat What You Kill/Silo model of operations and as the firm grows, these pure compensation calculations rarely support the strategic changes a firm has identified. Furthermore, these systems often motivate selfish, dysfunctional partner behavior who manipulate the formula for personal gain rather than firm success.
Compensation Averages for Multi-Owner Firms
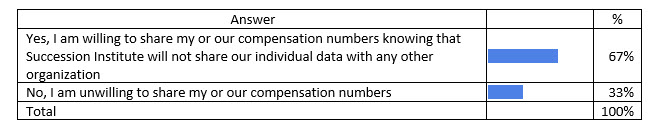
As this point of the survey, all participants were brought back together to answer all of the questions that follow. Since many firms don’t want to share their compensation history, rather than collect made up data to allow participants to finish the survey, we ask if they would be willing to share their results. Out of the 850 survey participants, 110 did not even answer this question and 493 (or 67% of the 740 respondents answering this question) agreed to share their compensation statistics.
Are you willing to share your average compensation for your most recently completed fiscal year?
Next, we wanted to make it clear what numbers we wanted them to share. For multi-owner firms, we specified that we wanted average partner compensation which included salary, bonuses and profit distributions. While we shared compensation numbers in “Who Responded to This Survey” section, we have shared the data in this section based on revenues (rather than FTEs) to give you a different look at the numbers.
Please provide your average compensation for your most recently completed fiscal year.
For the 303 responses from Multi-Owner Firms:
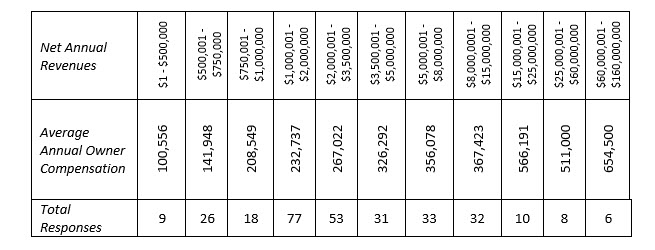
This table provides a clear message. The larger the firm, the more money owners can make. CPA firms make money by leveraging staff. Partners can work an enormous number of hours in small firms, taking on all of the burden of being the owner, manager, financial technician, client service person, work horse, etc., and they can clearly make an excellent living. However, the more staff a partner has working for him/her, the more money he/she can make.
With each jump in annual net revenues, except for one category, average owner revenue went up. Only the group from $25,000,001 to $60,000,000 went down as compared to the previous category. And because there were only 8 firms in this response group, this lower number could be explained by a few of those firms being over-partnered at the time of this survey in preparation for some succession changes.
CPA Firms are in the people business. You simply make more money by having more staff time to sell, not by having more partners to do the work. This is why we believe it is important for firms to pay attention to leverage (one of the compensation factors listed above) so that the partners will stop trying to carry the burden of work themselves. This will require them to delegate as much work as possible to staff (which requires staff training, another compensation factor we focus on), so that they can focus on doing the parts of their current jobs they are not doing because they are too busy being the firm’s work-horses.
Other Services
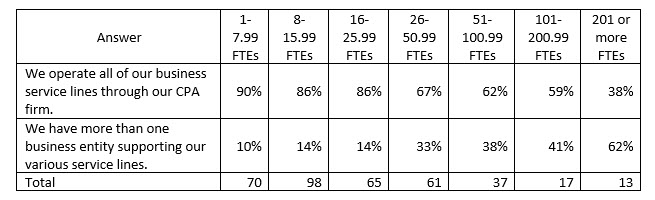
In this new question we asked this year, we wanted to understand how firms were organized to deliver their various service offerings. Of the 361 respondents, the larger the CPA firm, the more likely the firm will have other businesses supporting their service offerings (from 90% of the firms providing all of their service offerings through the CPA firm in the smallest size category to 38% doing the same in the largest firm size category).
Is your CPA firm operating more than one business entity to house its various service lines? (In other words, having a separate legal organization for the building you may own would NOT qualify as a separate business service line, but offering a Wealth Management service through a separate legal entity from the CPA firm would qualify here as a separate business service line.)
Next, we wanted to find out more about the additional service lines as well as businesses our CPA Firms were supporting.
Which of the business service lines below do you operate?
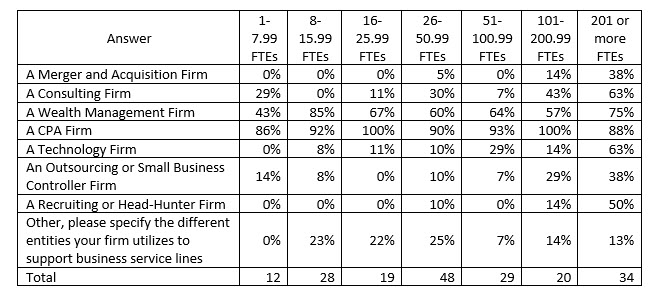
Among the 190 responses to this question, wealth management firms were the most popular second business operation, with consulting firms and technology firms roughly tied for second most favored. Outsourcing or business controllership was of greatest interest to the largest firms, but showed up in all size categories except the 16 to less than 26 FTEs size category. Merger and acquisition and headhunter operations were mostly only of interest to the two largest size categories of firms. These types of services have been offered in CPA firms for a long time, but in order to be able to attract the right talent to run them, many firms are formalizing these services in separate organizations to create more ownership flexibility. All of the services listed above can easily be tied to expanding the scope of services that would naturally be of interest to the personal and business clients of a CPA firm.
Finally, there were a number of responses for “Other.” Some of the written responses we received for this selection included:
- Payroll
- Trust and Fiduciary
- Risk Management firm / Cost Containment
- Low Income Housing Tax Credit, government subsidies
- HR Outsourcing
- Family office
- Information Security
Please share with us your firm's Net Annual Revenue for all of the other Business Service Line entities (gross revenue less write-offs) for your most recently completed fiscal year.
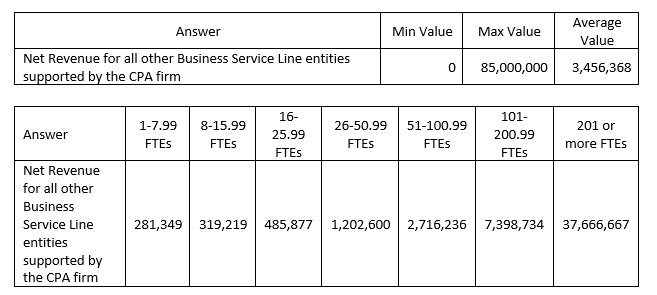
Of the 63 responses, the annual net revenue for these other service offerings had a minimum value of zero, a maximum value of $85,000,000, with an average response of almost $3.5 million. As you can see, the larger the firm, the more revenues are generated in businesses outside the CPA firm.
Wrap-Up
We will pick up at this point in the survey for our last column on the survey, Part 7, with Workload Compression. We will include some additional insight that was not part of the survey report to share some ideas you should be embracing and implementing now in order to help you mitigate the damage that continually expanding workload compression will predictably create within your firm in the next few years.
Download
| File |
|---|
| PCPS Succession Institute 2016 Survey Results for Multi-Owner Firms-Part 6 |

We help organizations implement their unique strategies by:
• Working with them through the tough issues, and
• Customizing responses to address root causes, rather than merely treating symptoms.