PCPS Succession Institute 2016 Succession Survey Results for Multi-Owner Firms Part 7
This article summarizes selected results of the Private Companies Practice Session (PCPS) and Succession Institute (SI) 2016 Succession Planning Survey (the full survey results available through the PCPS Resource Center). This is the fourth such survey conducted since 2004. Part 1 of this column series covered the results for Solo Practitioners and Sole Proprietors. Part 2 covered Demographics, Succession Plan Status, Ownership Retirement projections, and Firm Infrastructure. Part 3 started with Mandatory Retirement and concluded with the calculation of the original valuation of the retirement benefit. Part 4 reviewed how firms might adjust the original valuation benefit based on actions or inactions of the retiring partner. Part 5 discussed policies for transitioning client relationships and continued through the challenges firms are trying to address that represent barriers to your firm's effective succession management. Part 6 focused on addressing the People Side of Succession, Compensation and Other Entities CPAs commonly utilize. Now we pick up Part 7, our last section of the survey, which is about predicted Workload Compression. We have also included some additional insight that was not part of the survey report to share some ideas you should be embracing and implementing now in order to help you mitigate the damage that continually expanding workload compression will predictably create within your firm in the next few years.
Workload Compression
This year, especially given that workload compression was in the Top 5 Issues for CPA Firms of all sizes for 2015 in the PCPS Top Issues survey, we decided to go through a specific exercise we do with all of our firms. We take a look at the current revenue of the CPA Firm, the firm’s conservative projection of growth rates over the coming three years, the firm’s hiring plan, the firm’s retention rate, the average revenue per FTE, and determine whether the firm will be in greater workload compression at the end of the next three years than it is experiencing now. What we found, conservatively, is that even though firms feel workload compression is one of their most challenging issues to face and address, all indications based on our survey results is that across the US, workload compression will only get worse. This is not our profession’s burden to bear, but rather, a burden our profession chooses to bear, based on staffing decisions. So, we are now going to walk through those numbers.
Hiring for Growth
This year we again asked a series of questions that look at staffing patterns among responding firms. We started by asking how many new hires the firms had made in the last three years. A total of 352 Multi-owner firms responded to this question as follows.
In the last three years, how many people TOTAL have you hired during this period? We are not asking for an average over this three-year term, but rather the total number of people you have hired.
| Answer | 1-7.99 FTEs | 8-15.99 FTEs | 16-25.99 FTEs | 26-50.99 FTEs | 51-100.99 FTEs | 101-200.99 FTEs | 201 or more FTEs |
| Average total number of new hires in the last three years | 2 | 4 | 7 | 10 | 27 | 37 | 123 |
Next, we wanted to take a look at staff departures. During the last three years, respondents indicated the average staff turnover as shown below.
In the last three years, how many people TOTAL have left the firm during this period (for any reason - they were fired, they moved, they went to work for another firm, they retired, etc.)?
| Answer | 1-7.99 FTEs | 8-15.99 FTEs | 16-25.99 FTEs | 26-50.99 FTEs | 51-100.99 FTEs | 101-200.99 FTEs | 201 or more FTEs |
| Average total number of people that have left the firm for any reason during the last three years | 1 | 2 | 5 | 7 | 19 | 25 | 82 |
Compared to the previous survey results, the above tables show that firms have been doing a better job of hiring more staff than have left the firms. Yet, over the last four years, many to most CPA firms have experienced unprecedented growth opportunities. Thus, even though net hires (staff additions, minus staff departures) has improved, many firms are likely to be understaffed right now (especially given the priority of workload compression). In fact, in our current work with firms throughout North America, we frequently hear that our firms are somewhat understaffed now, but that the partners are trying to hire more people. In addition, we hear with even higher frequency, that firms need to do some serious trading up of talent as they are so shorthanded that they are keeping under-performers on board simply because any assistance provided by weaker employees (a body) is considered to be valuable since it might contain the powder-keg from blowing (the stress and current workload pressure) which might run off some of their best people.
Just to share our normal conversation regarding this topic, under-performers do not help keep your top performers. Based on our experience working with firms of all sizes, top performers, who are very aware of every marginal performer in the firm, are being slapped in the face every day a firm doesn’t address that under-performance. It is like telling your top performers that the firm doesn’t appreciate their efforts because you are holding on to people who your top-performers are constantly having to clean up after.
Additionally, one of the most common comments we get about being under-staffed is that our firms are desperately searching for experienced personnel to come in so they can hit the ground running. Firms have been using this strategy for decades. They continue to try to use it, even though this strategy stopped working about 20 years ago. If a firm wants to fix their staffing problem, there is ONLY ONE strategic way to accomplish this: Hire directly out of school, where there are plenty of candidates. This means firms will need to be prepared and focused on training those new hires. And if firms that are not doing this want to see how the profession is changing in this area, go back through this survey with the idea of training staff in mind. Notice the increased focus on competencies, developing a culture around training, holding people accountable for attaining goals, pushing work down, etc., as these are common steps required if you want to make your people better, stronger and do it faster.
Now that we have captured the planned number of new hires over the next three years, as well as being about to take into account the retention experience firms are anticipating over that same period, we now can estimate the expected number of additional people firms plan to have on board at the end of the next three years. Next, we want to understand the net revenue growth expectations over that same period, which leads us to the next question.
What is your firm anticipating regarding net revenues (from fees) over the next three years? Are you expecting them to increase, stay about the same (zero growth) or decrease over this three-year period?
| Answer | 1-7.99 FTEs | 8-15.99 FTEs | 16-25.99 FTEs | 26-50.99 FTEs | 51-100.99 FTEs | 101-200.99 FTEs | 201 or more FTEs |
| We are anticipating growth overall in revenues over the next three years. | 70% | 68% | 80% | 85% | 92% | 94% | 100% |
| We are anticipating both ups and downs in our revenue during this next three-year period with net revenues ending up about the same as they were last year (zero growth over this period). | 24% | 30% | 18% | 13% | 8% | 6% | 0% |
| We are anticipating a decline overall in revenues over the next three years. | 6% | 2% | 2% | 2% | 0% | 0% | 0% |
| Total | 70 | 96 | 65 | 60 | 36 | 17 | 11 |
The vast majority of firms expect continued growth over the next three years (for firms from 16 FTEs and more, with each FTE size category, the expectation for growth ranged from 80% at a low to 100% with the largest firms). With the exception of firms from 8 to less than 16 FTEs, the larger the firm, the more likely growth is expected. For the smaller firms (less than 16 FTEs), over 30% (30% for less than 8 FTEs and 32% for less than 16 FTEs) estimate revenues staying about the same (the vast majority of the responses for both of those two groups) or decreasing. This response could easily be explained by the fact that earlier in our survey, it was revealed that 40% of the solo practitioners and sole proprietors planned to retire in the next 5 years. Therefore, it is likely that some owners of smaller multi-owner firms see themselves slowing down and working less, which would have a direct impact on revenues.
For those expecting an increase in revenues over the next three years, we asked them to share what average annual growth they expected, as a percent of revenues. The average expected growth rate is between 6% and 8% per year, which averaged overall above 7%.
What is the average expected annual percentage growth in net revenues during this [three-year] period?
| Answer | 1-7.99 FTEs | 8-15.99 FTEs | 16-25.99 FTEs | 26-50.99 FTEs | 51-100.99 FTEs | 101-200.99 FTEs | 201 or more FTEs |
| Anticipated average % growth per year over the next three years | 7% | 7% | 8% | 6% | 8% | 7% | 8% |
Based on the data provided by firms regarding past staff additions and departures, current revenue per FTE and expected growth over the next three years, we were able to determine how adequately staffed the firms will likely be in the future. Why does this series of estimates work as a reasonable forecasting tool? Because we don’t find that average revenues per employee change much as we hire new people. Average revenues per employee change as cultures shift, as efficient and effective infrastructure is put in place, and as people are held more accountable, but it is a multi-year process. And if a firm is already working in that direction, while they could see an increase in average revenue per employee, this is likely due to these same infrastructure shifts. To grow at a faster pace than anticipated each level of employee, from partner on down, has to be doing a better job actually living up to their roles and responsibilities.
So, the increase in average revenue per employee is easily offset by the additional growth. As a planning tool, we run through this exercise with almost every firm we work with to help them see how much they are currently under-hiring, given their current plans and past experiences. Generally, the results of this exercise come as a shock to management. This is because, even though they believe they are being fairly aggressive regarding hiring, we have not found one firm that is hiring at a pace that has a chance to address their current problems with workload compression problem, gaps in competencies, partners doing managers’ work, etc.
As we expected, unfortunately, the following table shows that firms in all multi-owner FTE size categories will likely be short-staffed if their growth projections are realized, based on previous staffing patterns. The overall average percentage shortfall will be about 11% - 12%, with a range of from 8% to 13%, depending on size of firm. (This data is shown only for multi-owner firms in this year’s survey):
| Answer | 1-7.99 FTEs | 8-15.99 FTEs | 16-25.99 FTEs | 26-50.99 FTEs | 51-100.99 FTEs | 101-200.99 FTEs | 201 or more FTEs |
| Projected average percentage (under-staffed) at the end of three years | (11%) | (13%) | (12%) | (8%) | (12%) | (10%) | (13%) |
Some readers may claim that this is an overly pessimistic projection inasmuch as some staffing patterns have begun to change already with many firms trying to hire more people at a faster pace. However, we believe that these projections are in reality very optimistic! The shortfalls shown above do not reflect the need to replace any staff who currently are under-performing and won’t likely improve. Similarly, net shortages shown above have not been increased (“grossed up”) for the inevitable turnover that will occur among those additional people that need to be hired, especially with most of those new hires coming right out of school. Our experience with firms is that new hires right out of school have a turnover ratio of at least twice that of what we see with experienced hires simply because young people might not decide to stay in our profession, they are less likely to have roots in the current community, they are more likely to change locations to follow a loved one, and they also many not perform up to the level of expectation, just to name a few of the common reasons for increased turnover.
For example, if the table shows it will take 12% more people to meet projected business increases over and above the anticipated hiring based on past patterns, the firm probably will require even more. This would be due to the fact that many firms have been projecting their growth rate to be much lower than they have experienced. As well, a potential higher turnover among the new hires and the need to replace current marginal performers might make this number conservative as well. Thus, even if firms hire at a level to correct the current projected staff shortage (such as the 12% shown above), they still might be understaffed because of the factors just discussed. This is especially true when you consider that many firms are under-staffed to start with.
Given the current understaffing at many firms, together with data gathered from the survey, we have developed the following, simple “Quick Hiring” spreadsheet. This gives our firms a rough estimate of what they need to do to alter their current path. The bad news is … the spreadsheet can easily present a solution that seems totally unreasonable due to the number of new hires it shows under normal assumptions.
Take a look at the spreadsheet below. Notice that we start with a firm that has annual revenues of $4 million and 26 full time equivalent employees. With these numbers, this firm is generating revenue per person of $153,846. If you assume a 7% annual growth rate for three years, the firm would generate $4,579,600 in annual revenues by year three.
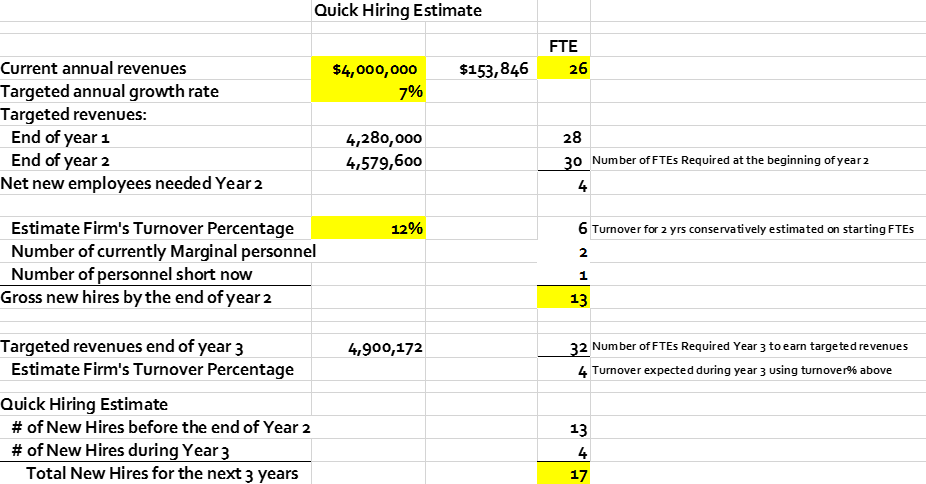
If you assume a 12% turnover rate, two marginal employees now that should be replaced, and the firm being one employee short right now, then the 26-person firm in this example needs to hire 17 additional employees during the next three years to only grow at a rate of 7% per year. The model also suggests that 13 of those new hires need to be hired in the first two years, (i.e., either hiring seven people in year one and six people in year two, or vice versa). Finally, consider that the typical firm with 26 employees would probably right now only plan to hire two-to-three new people at most per year and it becomes very clear why so many of our firms are going to end up in exactly the place they don’t want to be. They will end up with prolonged workload compression at every level creating frustrated staff who are starting to look for work/life balance at some other firm (and the departure of a few key quality staff doesn’t just exacerbate the situation, but better put, lights it on fire).
We realize that some of that growth in the example above is likely just price increases rather than additional work that requires additional people. But rather than trying to justify, rationalize and defend your current hiring practices, consider that, between the survey results and this quick hiring summary, maybe you simply are not hiring enough people. Yes, while we can poke holes in the data and this simple spreadsheet just as easily as you can, consider the fact that some firms have turnover rates in excess of 12%, and some have marginal employees in excess of 8%, some are currently understaffed by more than 4%, and some are growing at a rate faster than 7%. While these are all just data points that can easily vary, the likelihood that the current hiring plan for this firm (two-to-three new hires per year) is 1) NOT enough to correct the current workload compression being experienced, 2) isn’t likely even going to bring on enough people to replace the turnover that will occur in this firm during that period, 3) certainly isn’t robust enough to start building a bench to replace marginal people and fix the short staffed situation, and 4) doesn’t create the work bandwidth necessary to take on whatever growth the firm is enjoying.
The overall message here is simple. If you want to build a better, faster, stronger firm, you have to start with creating adequate capacity. Adequate capacity positions the firm to achieve far more in the future than it can today, such as:
- Organic Growth: Freeing up partner and manager time to spend more time with clients, which then generates more revenue growth
- Increased Loyalty: Spending more time in front of top clients allows the firm to become better advisors to their clients, therefore creating additional loyalty and referrals to the firm.
- Less Price Sensitivity: The commodity services become less price-sensitive due to being coupled with the higher-valued advisory services
- Greater Leverage: More capacity allows employees at every level to push more work down to lower level people to create greater leverage, therefore also generating additional profitability
- Reduced Workload Compression: Greater capacity makes it easy for our younger people to find work/life balance, and more important, this flexibility reduces the chance of driving them off to find work/life balance somewhere else
- More Accountability to the Job: Capacity, or the lack thereof, is the single biggest reason why people in firms are currently working below their level. It is why partners often work like managers, why managers work like supervisors and so on. If you don’t have enough people, everyone will have to give priority to just getting the work out rather than filling their entire role, including business development, people development, organizational development, etc. for firm leaders
- Faster People Development: Without adequate capacity, no one will ever have the time to adequately monitor, provide feedback, train, coach and hold people accountable to getting better, faster and stronger. We need to make sure that people at every level are living up to all of their expected competencies instead of only a selected few
- Trading Up: Without greater capacity, the firm will never be in the position of replacing their marginal people or trading up for better ones. It is not that marginal people don’t have skills. Rather, it is usually that these people have too much of some competencies, and not any of others. These are the people that others are actively carrying the water for, or they are the ones everyone works around in order to limit their interactions with. The point is … it is difficult to let go of someone who is producing something, especially in a heavy workload environment, until you have someone who can step up and carry at least part of the load.
The longer the time a firm stays in this under-capacity mode, the more difficult it is to get out of it, and the more dysfunctional the firm becomes because the partners don’t think they can afford to let go of any producing staff, no matter how disruptive or incompetent, due to the added pressure that a vacancy puts on their top performers. Eventually, however, the marginal people stay while being overpaid, and top people leave due to the frustration of having to carry both the work-load and the technical load required due to constant understaffing.
Just to be clear, we don’t think our profession has as much of a workload compression problem as we think our profession has a management problem. Our profession has been creating a staffing shortfall and ever-growing competency gaps for decades due to years of hiring at less than adequate levels. As well, due to being short-staffed, management has in many cases created a people development culture less than adequate to support the firms they have built. The solution to so many problems our firms are encountering, even those enjoying enormous success, is doing a better job of creating adequate capacity. Or better put, there is no quicker way to spin successful firms into dysfunctional ones, profitable firms into insolvent ones, or firms that have lasted for generations into unsustainable ones, than inadequately staffing for the revenue volume a firm is driving. The handwriting is on the wall … we suggest it is time to READ IT!
We hope you have enjoyed this 7-part series of columns on the 2016 PCPS Succession Institute Succession Survey.
Download
| File |
|---|
| PCPS Succession Institute 2016 Succession Survey Results for Multi-Owner Firms-Part 7 |
We help organizations implement their unique strategies by:
• Working with them through the tough issues, and
• Customizing responses to address root causes, rather than merely treating symptoms.